
The question I couldn't ignore
Financial fraud costs the global economy more than $40 billion a year, and machine learning has become the default weapon against it. XGBoost and other gradient-boosted models now sit inside real-time payment pipelines, scoring transactions in milliseconds and, increasingly, explaining themselves — SHAP values sit next to every flagged transaction so a fraud investigator can see why the model made its call, and a compliance officer can audit it later.
That combination — high-accuracy detection plus human-readable explanation — is treated as a solved problem in most fraud engineering teams. My MSc thesis started from a more uncomfortable premise: what if the explanation itself can be attacked?Not just the classifier's decision, but the reasoning a human is shown for that decision.
I built an empirical study around a specific, dangerous question:
If an adversary deliberately perturbs a transaction to evade an XGBoost fraud classifier, what happens to the SHAP explanation a fraud analyst would see — and does the system still satisfy the EU AI Act's transparency requirements?
The short version of the answer: the classifier can be evaded with near-total reliability, and worse, the explanationsdon't just get less accurate under attack — they get systematically inverted. A feature SHAP calls the strongest fraud signal under normal conditions can become one of the leastimportant signals under adversarial perturbation. That's not a minor accuracy hit. That's a fraud analyst being confidently told the wrong story.
Setting the stage
The study used the PaySim mobile money simulation dataset, filtered to the two transaction types where fraud actually occurs (CASH_OUT and TRANSFER), with four domain-engineered features layered on top of the raw balance and amount fields — the strongest of which, balance_change_orig, captures whether a sender account was drained to zero (true in 98.05% of fraud cases in this dataset).
Three baseline models were trained and compared — Logistic Regression, Random Forest, and XGBoost — with XGBoost selected as the primary model for its native compatibility with SHAP's TreeExplainer and its prevalence in real industrial fraud stacks. On a held-out test set of 7,500 transactions (1,232 fraud), it reached an AUPRC of 0.9968 and an AUROC of 0.9977— strong numbers, though worth flagging honestly: PaySim's simulated fraud is more structurally regular than real-world data, so these figures reflect the benchmark's own characteristics as much as the model's quality. The real contribution of the study isn't the detection score — it's what happens next.
Two white-box gradient attacks (FGSM and PGD) and one black-box decision-based attack (HopSkipJump) were run against the baseline model, each constrained to stay within domain-realistic bounds — perturbations couldn't push balances negative, couldn't violate known accounting identities, and had to respect the model's original categorical structure. Every one of the 21 attack configurations passed all four realism checks. This wasn't a toy adversarial demo; it was built to reflect what an adversary constrained by real transaction semantics could actually do.
Finding 1: the model has no resistance at all
The first result was blunt. FGSM and PGD both achieved an Attack Success Rate of 1.0000— 100% — at every single epsilon value tested, including the smallest perturbation budget (ε = 0.01), which corresponds to changes small enough not to trigger any rule-based alert or look unusual in a raw transaction record.
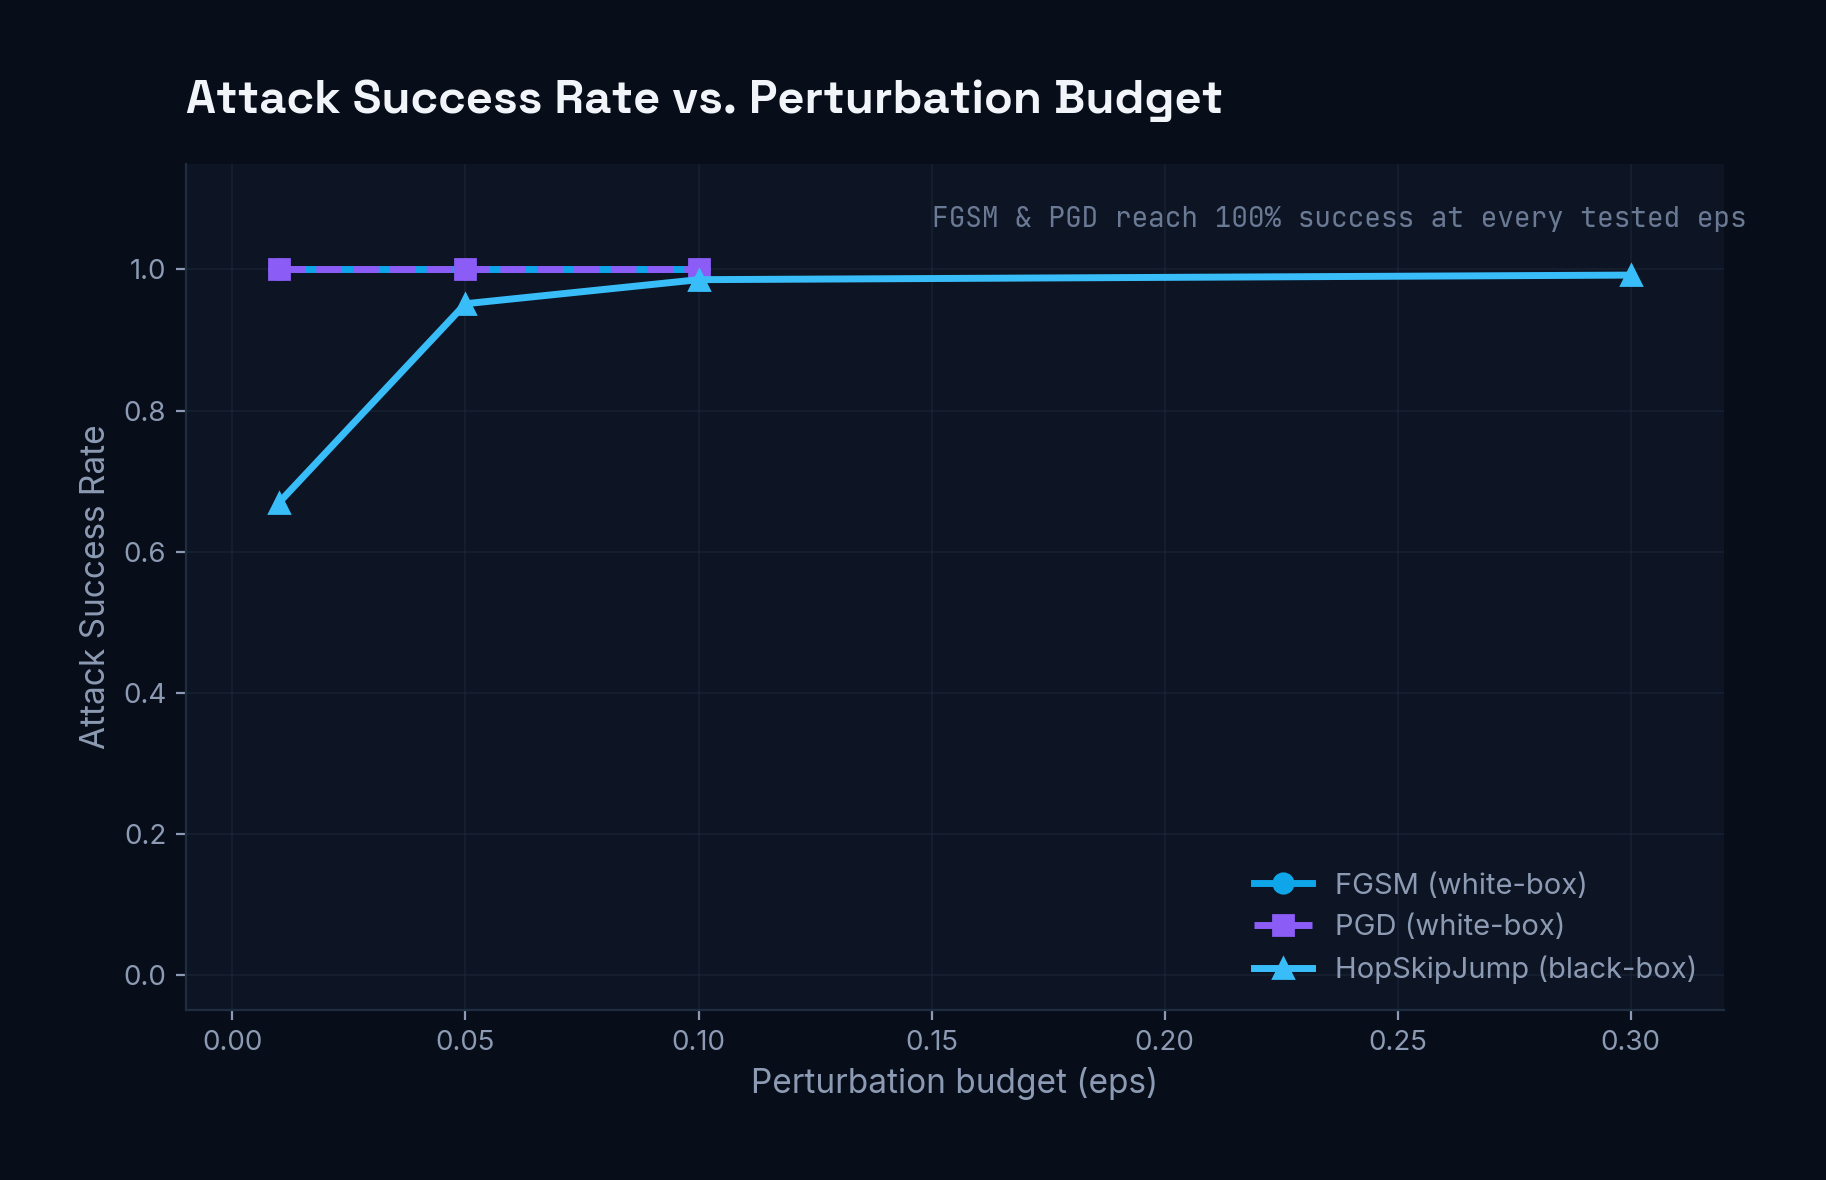
Attack Success Rate vs. Perturbation Budget (ε) across FGSM, PGD, and HopSkipJump
HopSkipJump, the black-box attack with no access to model gradients at all, climbed from an ASR of 9.8% at a vanishingly small perturbation budget to 99.19%at ε = 0.30 — confirming that an attacker doesn't need any internal access to the model. A query-only interface, the kind every deployed fraud-scoring API exposes by design, is sufficient.
The more revealing metric, though, wasn't ASR — it was how far AUPRC collapsed under attack. PGD consistently did more damage than FGSM (AUPRC dropping to 0.198 versus FGSM's 0.26–0.39across epsilon values) despite both achieving identical 100% success rates, because PGD's iterative optimization pushes predictions further past the decision boundary rather than just across it. Reporting attack success rate alone hides this — a model can be “100% evaded” in two very different ways, and only one of them leaves probability scores anywhere near ambiguous.
Finding 2: the explanations don't degrade — they invert
This is the part of the thesis I think matters most, and the part most fraud engineering teams aren't measuring at all.
I tracked three metrics comparing each transaction's SHAP explanation before and after adversarial perturbation: Spearman rank correlation between clean and adversarial feature rankings, the top-3 feature flip rate, and the L2 distance between the two SHAP vectors.
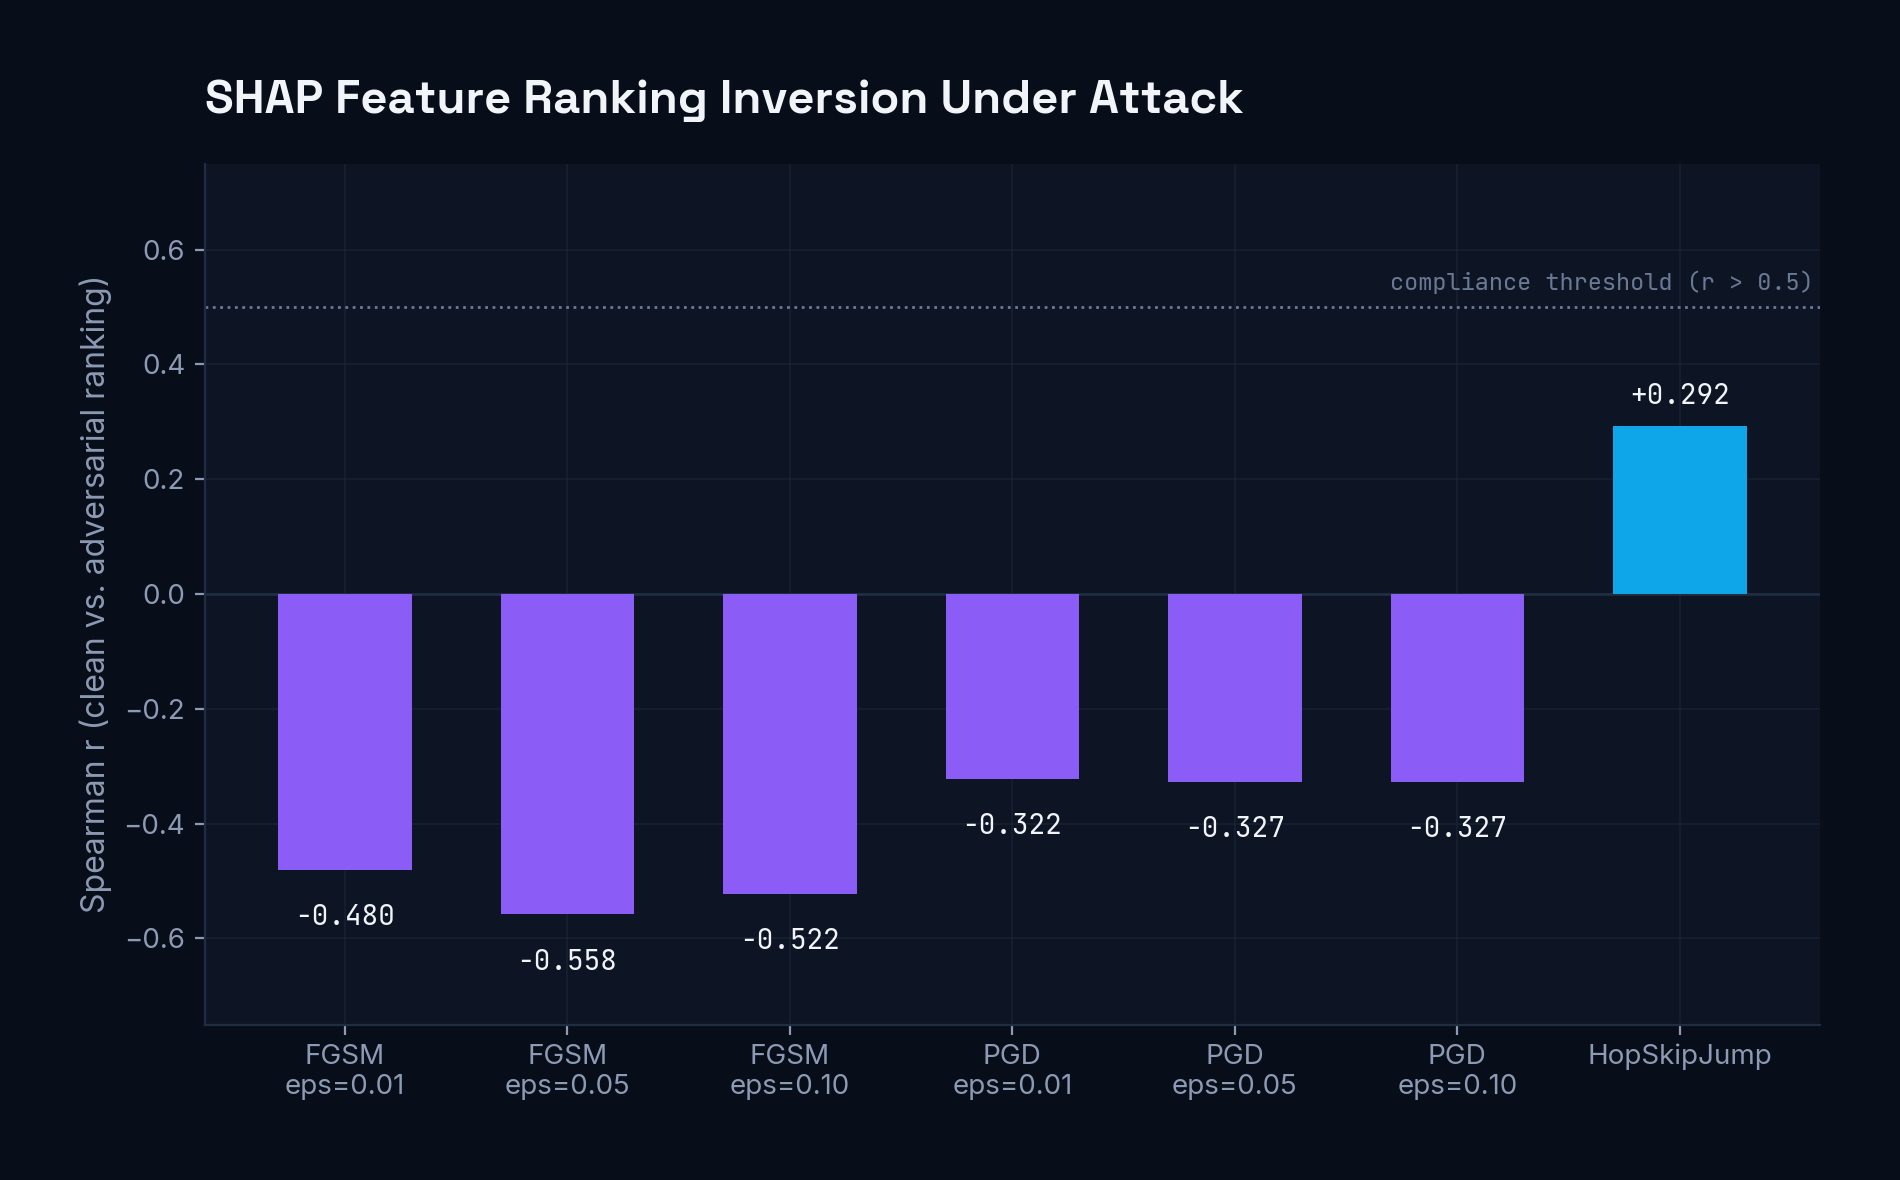
SHAP Feature Ranking Inversion Under Adversarial Attack — Spearman correlation and flip rates
Under FGSM at ε = 0.05, the mean Spearman correlation was −0.558. Not low. Negative. That means the feature ranking under attack is approximately the reverseof the clean ranking — the feature SHAP identifies as the dominant fraud signal on a clean transaction can become one of the least important signals once that same transaction is adversarially perturbed. PGD showed a less severe but still consistently negative inversion (ρ ≈ −0.322 to −0.327 across epsilon values), and even HopSkipJump — the attack that preserved a positive correlation (+0.292) — still flipped the top-3 feature set entirely in 31.2% of cases.
At FGSM's highest tested epsilon, 36.3% of fraud explanations presented a completely different top-3 feature setthan they would have on the clean transaction. Put plainly: for more than a third of adversarially perturbed fraud cases, a fraud analyst relying on the model's explanation would be looking at a plausible-sounding, confidently-presented, and wrong story about why the transaction was flagged.
This is a meaningfully different failure mode from “the model got fooled.” The classifier being evaded is a known, well-studied risk. The explanation system actively misleading a human reviewer, while looking exactly as legitimate as it does on any clean transaction, is a much harder problem to catch — because nothing about the interface tells you it happened.
The fix, and its limits
Adversarial training — retraining XGBoost on a 50/50 mix of clean and PGD-generated adversarial examples — closed most of this gap. Gradient-attack ASR dropped from 1.0000 to 0.0000–0.0049, a 99.5–100% reduction, while clean-data AUPRC only dropped by 0.16%(0.9968 → 0.9952) — meaning the defence didn't meaningfully cost any detection performance on legitimate traffic. A Wilcoxon signed-rank test confirmed this was statistically significant (p = 0.0156), with an effect size (Cohen's d = 552) about as large as effect sizes get.
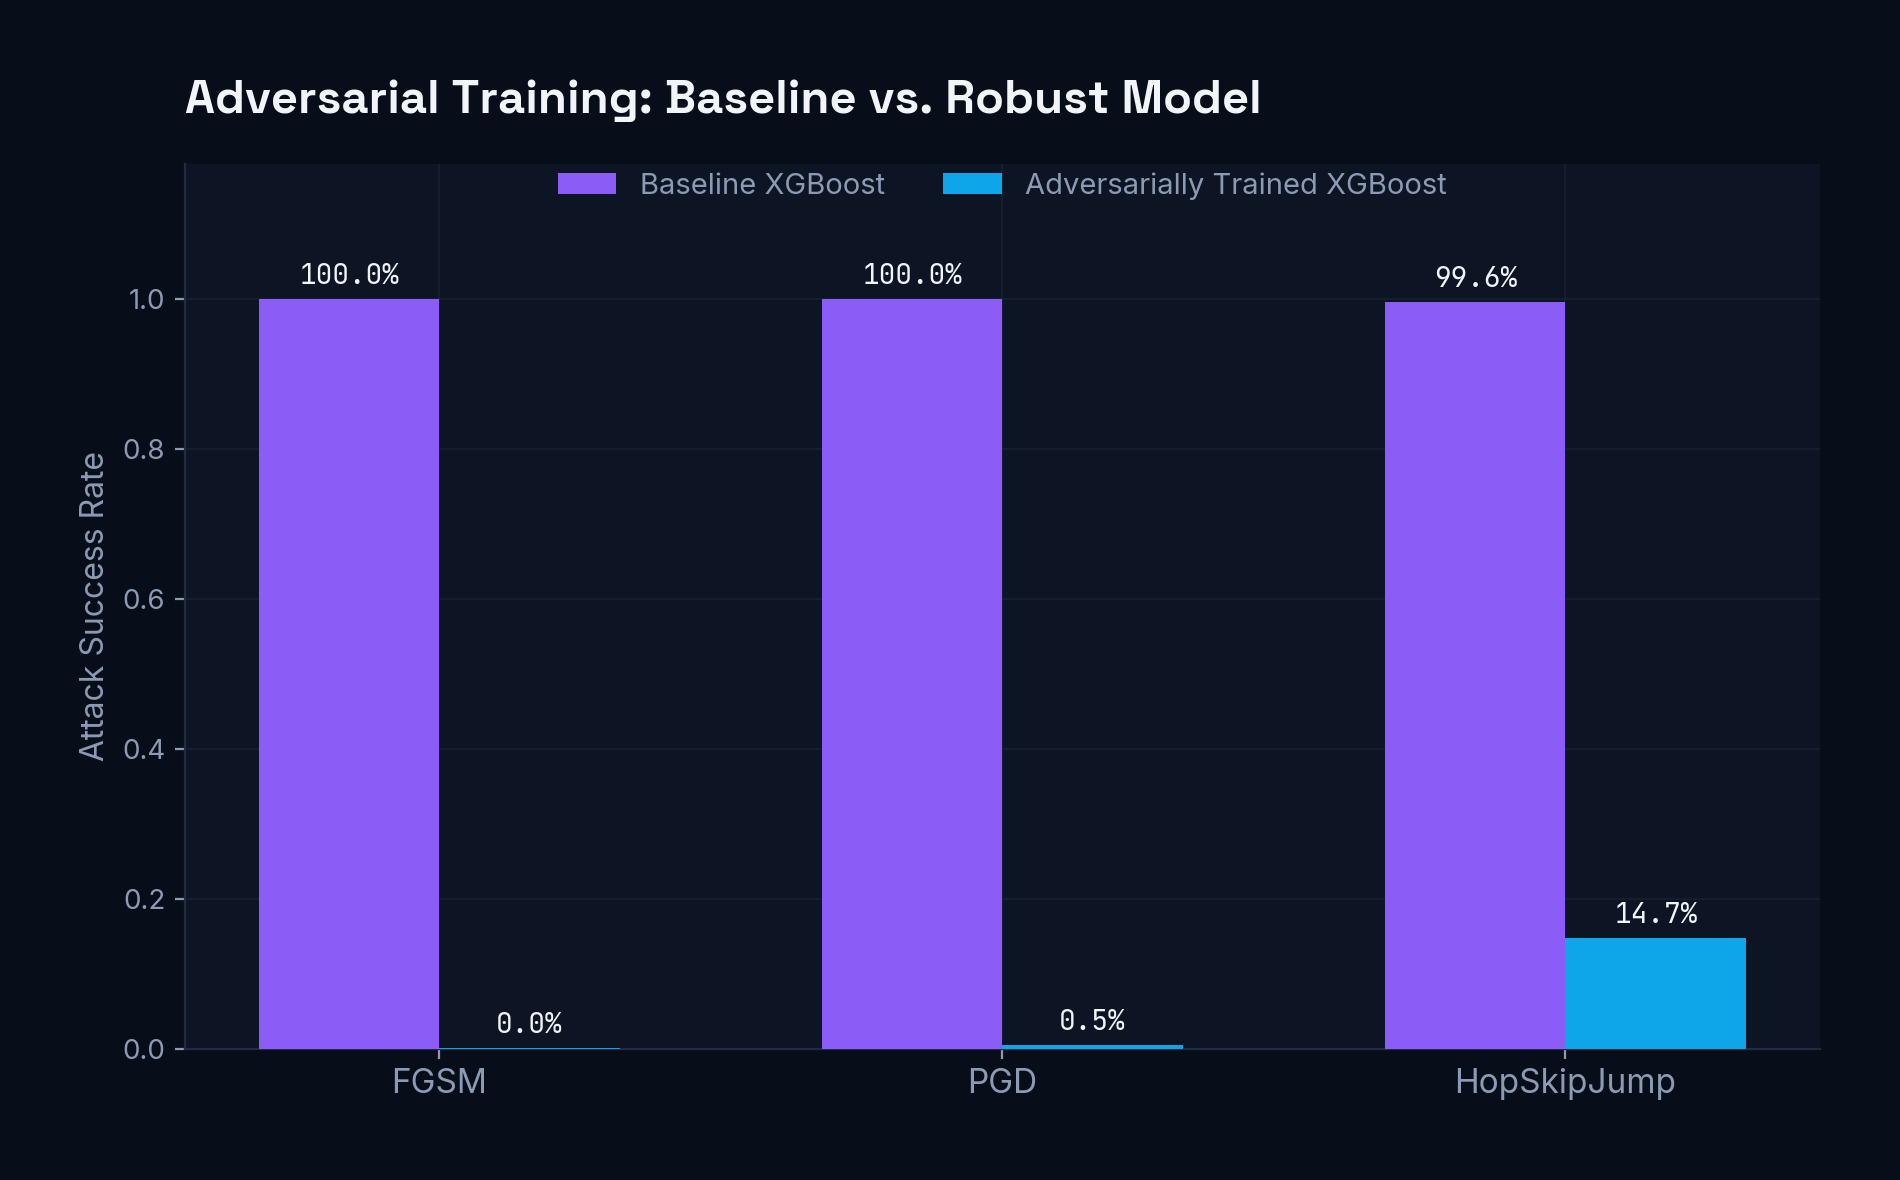
Adversarial Training: Baseline vs. Robust Model — AUPRC and ASR comparison
The defence was noticeably weaker against HopSkipJump — an 85.2% ASR reduction rather than 99%+ — which makes sense: PGD-based adversarial training hardens a model against the specific gradient directions it was exposed to during training, while a decision-based black-box attack explores different regions of the decision surface entirely. It's also worth being honest about a theoretical gap here: adversarial training for gradient-boosted tree ensembles doesn't come with the same formal robustness guarantees that exist for differentiable neural networks under the Madry et al. framework. What's demonstrated here is a strong empirical improvement, not a certified one.
Mapping it to the EU AI Act
Because Regulation (EU) 2024/1689 treats systems like automated fraud detection as potentially high-risk under Annex III, I built a conceptual compliance framework mapping nine technical controls from this study to Articles 9 (risk management), 13 (transparency), and 15 (accuracy, robustness and cybersecurity) — with the explicit caveat that this is a research-level mapping, not a formal legal conformity assessment.
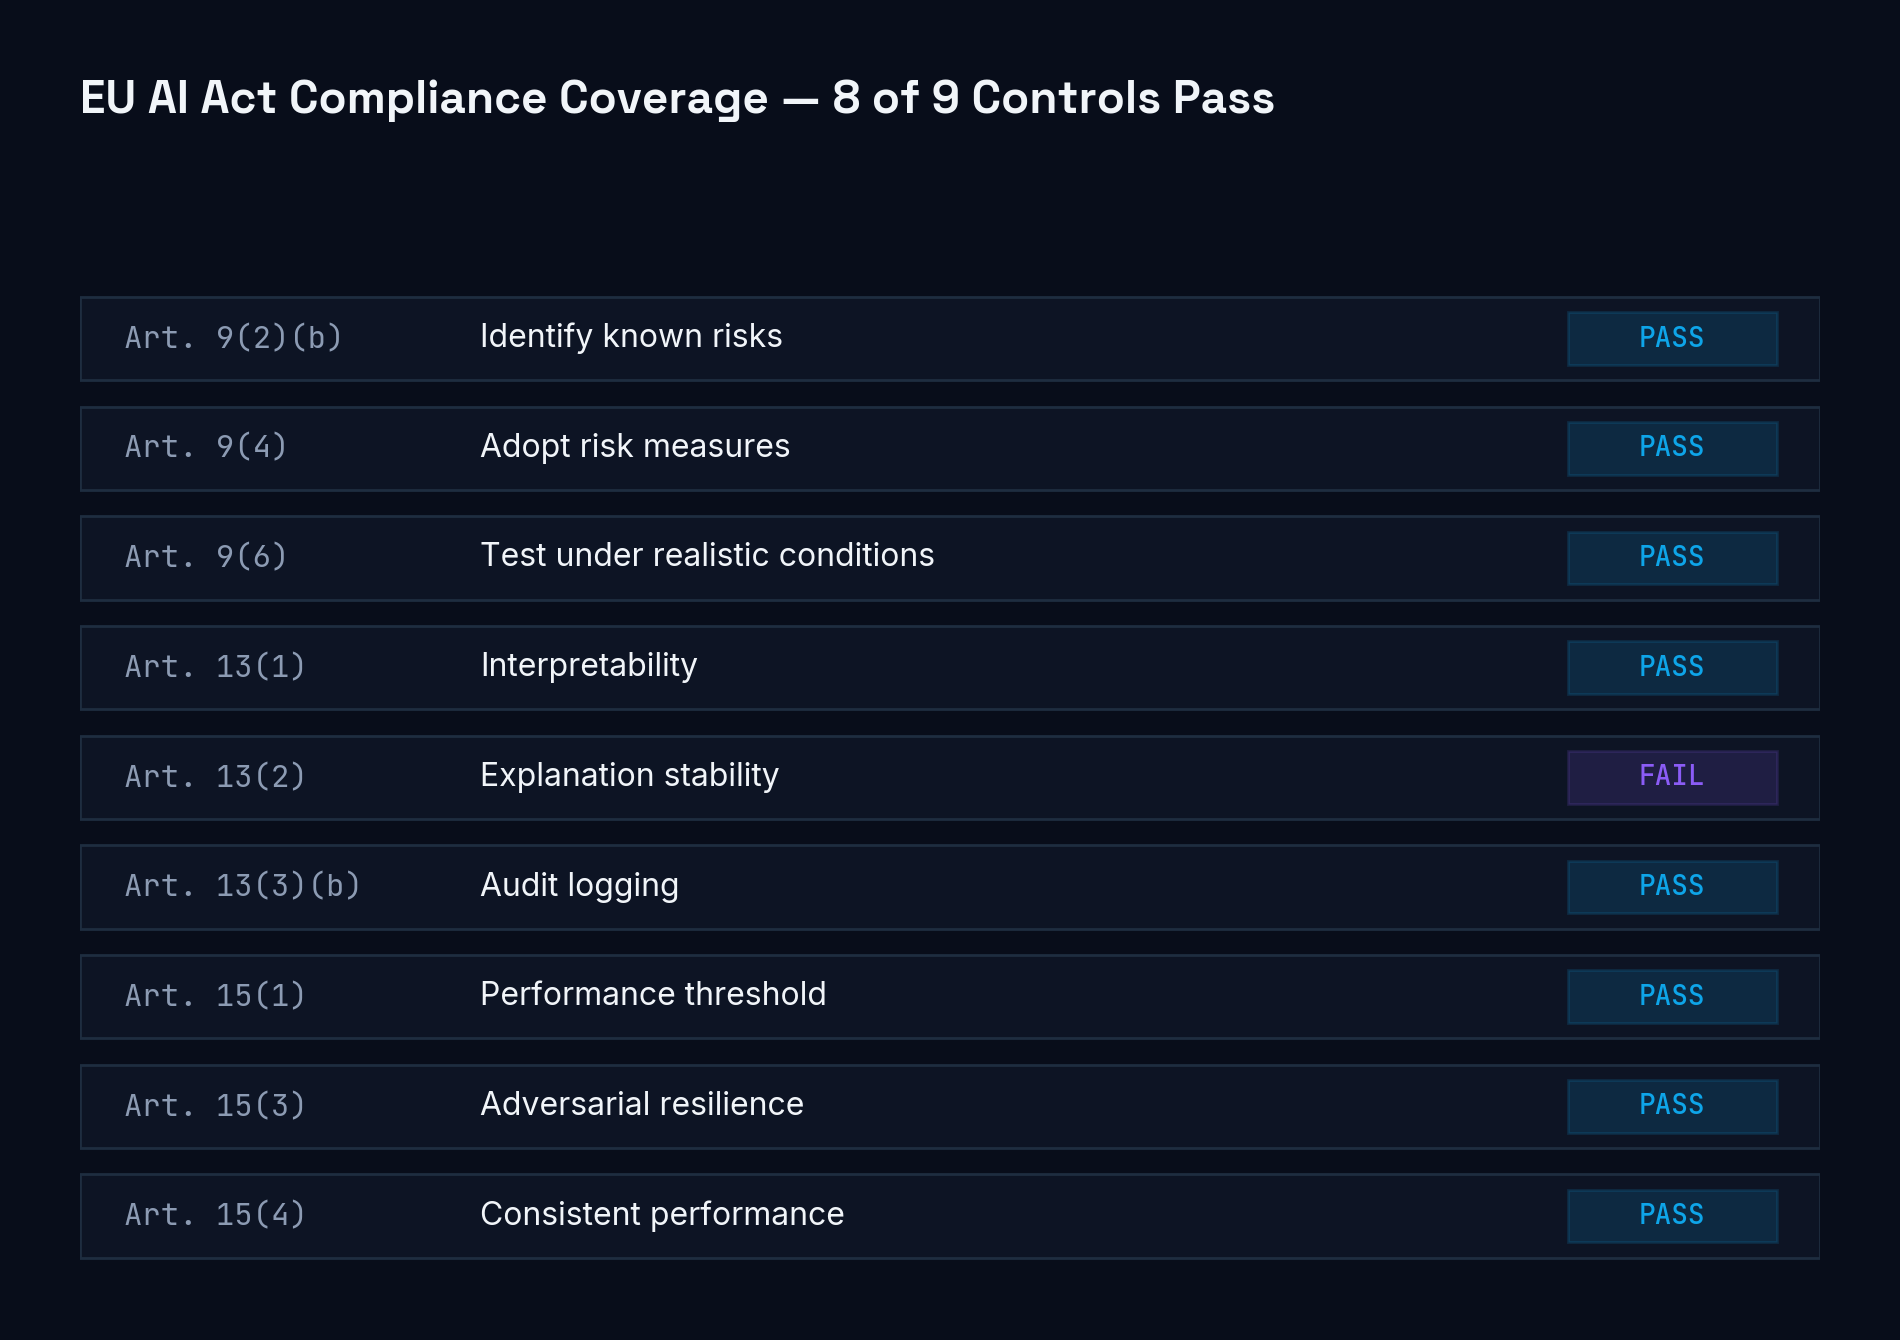
EU AI Act Compliance Coverage — nine technical controls mapped to Articles 9, 13, and 15
Eight of the nine controls passed cleanly. The one that didn't is, unsurprisingly, Article 13(2) — explanation stability under operational conditions. An undefended model cannot claim its explanations remain interpretable and trustworthy once it's operating in an adversarial environment, because the empirical data says otherwise: a worst-case Spearman correlation of −0.558 is about as far from “stable” as a ranking metric can get. That single FAIL is arguably the most useful finding in the whole thesis — it's not a methodology weakness, it's the regulation correctly catching a real gap that most fraud teams aren't instrumented to see.
What I'd tell a fraud engineering team
A few takeaways I keep coming back to:
- ›Attack Success Rate alone is an incomplete metric.Two attacks with identical 100% ASR can leave very different AUPRC damage behind. If you're only tracking whether the model was fooled, you're missing how badly.
- ›If you show explanations to humans, test explanation stability — not just prediction accuracy — under attack. A model can look fully interpretable in every demo and still mislead reviewers on a meaningful fraction of adversarial cases, because nobody thought to check whether the explanation survives adversarial pressure the same way the prediction does.
- ›Adversarial training is a strong, cheap first line of defence for tree ensembles— a 99%+ ASR reduction for a 0.16% clean-accuracy cost is a very good trade — but it isn't a complete answer, especially against black-box attacks, and it doesn't come with formal guarantees the way it does for neural networks.
- ›Regulatory frameworks like the EU AI Act are, in this case, pointing at a real gaprather than adding box-ticking overhead. The Article 13(2) failure mode here is one most fraud teams aren't currently measuring at all.
The full methodology — dataset processing, the finite-difference gradient approximation used to attack XGBoost without native gradient access, the complete statistical results with bootstrap confidence intervals, and the full nine-control compliance assessment — is available in the project writeup and code.